TRU Market Education Blog
TRU
Big Data Day: What Today’s Economic Reports Mean for Mortgage Rates
Inflation, jobs, GDP, housing supply, durable goods, and oil all matter because they shape the bond market’s view of where mortgage rates should go next.
Mortgage RatesPCE InflationJobs DataGDPOil & Inflation Risk
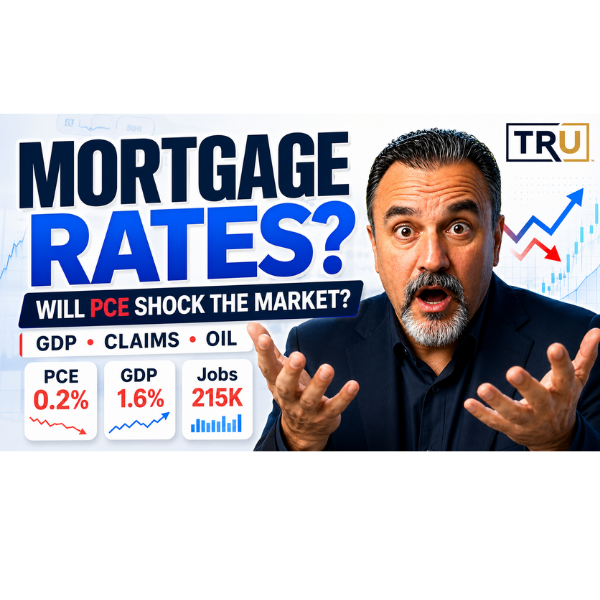
Core PCE Month-over-Month
0.2%
Cooler than the 0.3% estimate.
Mortgage-rate friendlyCore PCE Year-over-Year
3.3%
In line with estimates, but still too high for the Fed.
Sticky inflationGDP Q1
1.6%
Below the 2.0% estimate, suggesting slower growth.
Bond-friendlyInitial Jobless Claims
215K
Higher than expected, showing slight labor-market softness.
Rate-friendlyThe Big Picture
Today’s data was mostly helpful for mortgage rates, but it was not a clean victory. The best news was that Core PCE month-over-month cooled to 0.2%, which is important because Core PCE is the inflation gauge the Federal Reserve watches most closely.
The challenge is that inflation is still running above the Fed’s comfort zone on a year-over-year basis. That means the bond market may like the monthly improvement, but it still needs more proof before mortgage rates can make a major sustained move lower.
Simple takeaway: Mortgage rates finally got some help from cooler monthly inflation, softer labor data, and weaker GDP. But inflation is not solved yet, and oil remains the wild card that can keep pressure on prices.
Economic Data Dashboard — Good or Bad for Mortgage Rates?
| Report | Actual | Estimate | Prior | Mortgage Rate Read | Why It Matters |
|---|
| Building Permits | 1.423M | 1.442M | 1.363M | Mixed / Housing Positive | Permits missed estimates but improved from the prior reading. More future supply is helpful for buyers, but this is not usually the biggest bond-market mover. |
| Continuing Jobless Claims | 1,786K | 1,780K | 1,771K | Rate Friendly | More people staying unemployed suggests the labor market is softening. Softer employment usually helps bonds and can help mortgage rates. |
| Initial Jobless Claims | 215K | 211K | 210K | Rate Friendly | Claims came in higher than expected. That signals cooling labor demand, which can reduce wage and inflation pressure over time. |
| Core PCE Price Index MoM | 0.2% | 0.3% | 0.3% | Rate Friendly | This is the best inflation line for mortgage rates. Core PCE is the Fed’s preferred inflation gauge, and a cooler monthly reading helps bonds. |
| Core PCE Price Index YoY | 3.3% | 3.3% | 3.2% | Sticky Inflation | It matched estimates, but inflation is still well above the Fed’s 2% target. That limits how much rates can improve. |
| PCE Price Index MoM | 0.4% | 0.5% | 0.7% | Rate Friendly | Headline PCE cooled from the prior month and was below estimate. Good for bonds, but energy and oil can reverse this quickly. |
| PCE Price Index YoY | 3.8% | 3.8% | 3.5% | Rate Pressure | Inflation is running hotter than the prior year-over-year pace. That keeps the Fed cautious and keeps mortgage rates sticky. |
| GDP QoQ Q1 | 1.6% | 2.0% | 0.5% | Rate Friendly | GDP missed expectations. Slower growth can help bonds because it reduces the argument for “higher for longer.” |
| GDP Price Index QoQ Q1 | 3.5% | 3.6% | 3.6% | Slightly Better, Still Hot | Prices were slightly cooler than expected, but still elevated. This supports the “inflation is sticky” story. |
| Core PCE Prices Q1 | 4.4% | 4.3% | 2.7% | Rate Pressure | The quarterly core inflation component is hot. This is a caution flag for the bond market even if the monthly Core PCE looked better. |
| Durable Goods Orders MoM | 7.9% | 4.0% | 1.3% | Rate Pressure | Strong durable goods demand suggests the economy still has momentum. Strong growth can push yields higher. |
| Core Durable Goods Orders MoM | 1.1% | 0.5% | 1.1% | Rate Pressure | Core orders were stronger than expected, another signal that economic demand has not fully cooled. |
| Personal Spending MoM | 0.5% | 0.5% | 1.0% | Mixed | Spending matched estimates and slowed from the prior month. That is not alarming, but it does not scream recession either. |
What This Means for the Bond Market
Bond-friendly signals:
Core PCE MoM cooled, jobless claims rose, GDP missed estimates, and headline PCE MoM cooled versus the prior reading.
Bond-unfriendly signals:
Year-over-year inflation is still elevated, quarterly Core PCE prices were hot, and durable goods were much stronger than expected.
Real estate angle:
Building permits improved from the prior reading, which helps the future supply story, but affordability is still controlled by payment, mortgage rates, taxes, and insurance.
Oil angle:
Oil is the wild card. If oil stays high or spikes again, inflation expectations can rise and make it harder for mortgage rates to fall.
Why Oil Matters So Much
Oil is one of the biggest inflation wild cards because it can feed through gasoline prices, shipping, transportation, food costs, manufacturing, and consumer expectations. Even when a monthly inflation report looks better, rising oil prices can cause the bond market to worry that inflation pressure may come back.
For mortgage rates, the issue is not just today’s inflation number. The issue is whether bond investors believe inflation is truly cooling or whether energy prices could keep the Fed cautious.
Final Takeaway
Today’s data is mildly better for mortgage rates, but not a victory lap. The market got cooler monthly inflation, softer labor data, and weaker GDP. But inflation is still above target, parts of the economy are still strong, and oil can keep pressure on prices.
That means the correct message is not “rates are collapsing.” The correct message is: mortgage rates finally got some help, but they still need inflation and oil to cooperate.
Take the Next Step
Want to compare your options or monitor when the numbers finally make sense? Use the links below.
Tip: Use your browser’s Print or Save as PDF option to create a PDF version of this blog handout.