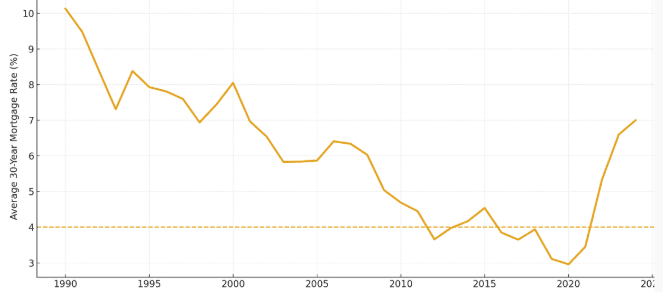
Source: Freddie Mac PMMS (annual averages, approximated for visualization). Dashed line marks a 4% benchmark.
Key Takeaways ✍️
- 1990s: mostly 6–9% — 4s were unicorns 🦄
- 2000–07: mid‑5s to low‑6s during boom 🔁
- 2010s: QE era brought 3s–4s 📉
- 2020–21: pandemic trough near ~3% 🧊
- 2022–24: inflation + supply = 6s–7s 🔥
Talking point: “4%” appears when inflation is anchored ~2% and the Fed is easing 🎯
Path Back to the 4s 🧭
- Inflation drifting to ~2% (core services cooling) 🧮
- Fed cuts + tighter term premium ✂️
- Slower growth without credit stress 🧯
- Less Treasury/MBS supply or stronger demand 📈
Watch: CPI/PCE • Jobs • 10‑Yr • MBS spreads 👀
Buyer Playbook 🧩
- Plan payments at today’s rate; treat sub‑5% as upside 📊
- Use seller credits / buydowns to bridge affordability 🧾
- Lock‑and‑shop now; refi when spreads compress 🔒➡️🔓
- Improve credit + DTI to hit best‑execution pricing ⭐
Live Q&A Prompts 🎤
- “Were the 4s normal?” → Only in QE/post‑crisis windows ⏳
- “6s → 5s?” → Inflation, Fed, spreads, supply ⚙️
- “When?” → Data‑dependent; watch 10‑yr & MBS OAS ⌛
Clip this: “You buy the home; you refinance the rate when math allows.” 🎬
This Week’s Market Radar 🛰️
- Key releases: CPI/PCE • Jobs • ISM • FOMC minutes 📅
- Watch the 10‑Year and MBS spreads for rate direction 🧭
- Headlines to cite: Yahoo Finance, CNBC, Mortgage News Daily 📰
Featured Media Appearances — Dan Frio in the News 🎥