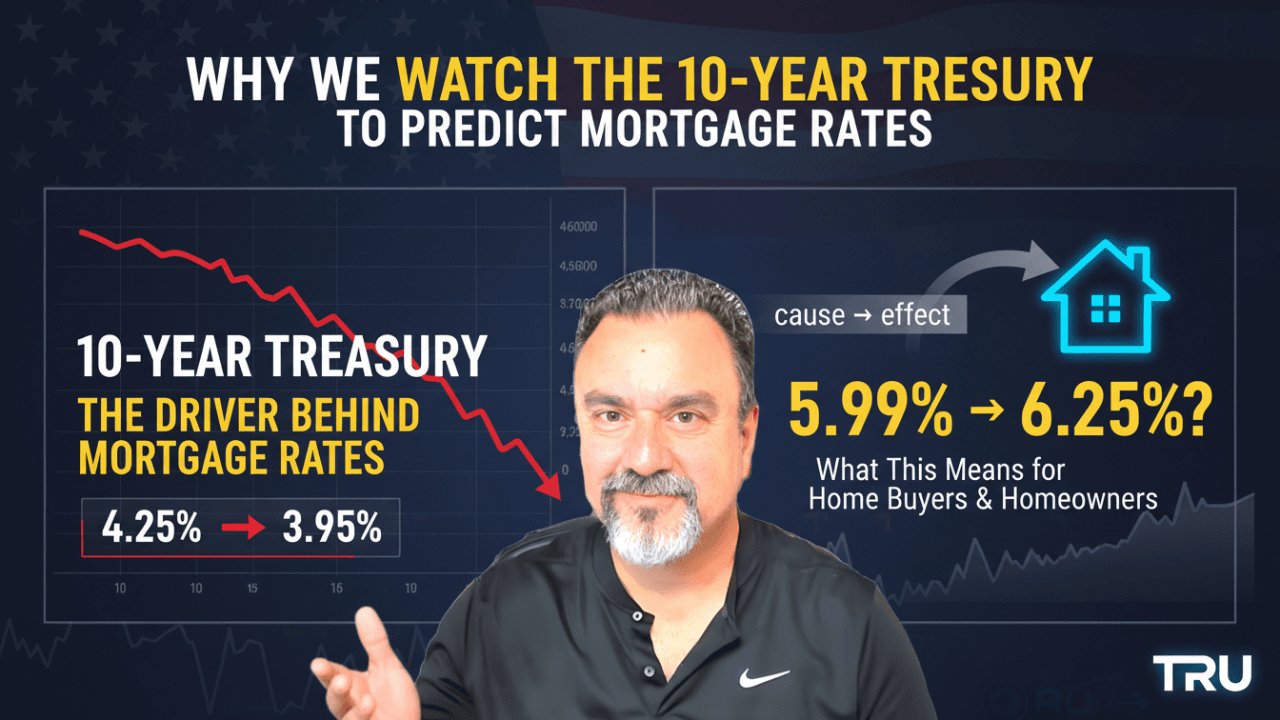
In today’s Morning Brief, Dan Frio breaks down—in plain English—why the 10-year U.S. Treasury yield is the anchor for long-term borrowing costs and why mortgage rates tend to move with it. You’ll learn how mortgage‑backed securities (MBS) are priced, what the “spread” is, what pushes the 10‑year up or down, and how to translate bond moves into real decisions like lock vs. float.
What you’ll learn
- Why the 10-year matters: It’s the benchmark investors use to price long‑dated loans.
- How mortgages are priced: MBS typically trade ~1.5%–2.0% above the 10‑year to compensate for prepayment and credit risk.
- The drivers of yields: Inflation expectations, economic data, Fed signaling, Treasury auctions/supply, and “risk‑on/risk‑off” flows.
- Why some days mortgage rates don’t move in sync: MBS‑specific dynamics and intraday reprices.
- Action playbook: Practical lock/float guidelines for buyers and refinancers.
The core idea (simple)
Think of the 10-year Treasury yield as the economy’s long‑term base rate. Mortgage investors buy pools of home loans (MBS). Because those bonds are a bit riskier than Treasuries, investors demand a spread above the 10‑year—commonly ~1.5%–2.0%.
- If the 10‑year yield rises, the base cost of money rises → mortgage rates tend to rise.
- If the 10‑year falls, funding gets cheaper → mortgage rates tend to fall.
Example: If the 10‑year is 4.00% and the MBS spread is ~1.8%, 30‑yr fixed rates often cluster near ~5.8%–6.0%, before lender‑level adjustments (credit score, LTV, product, points).
What actually moves the 10‑year?
- Inflation expectations – Hotter inflation → higher yields; cooling inflation → lower yields.
- Macro data – Jobs, CPI/PCE, retail sales, ISM, GDP. Strong data = growth & inflation risk → yields up; weak data → yields down.
- Federal Reserve guidance – The Fed sets short rates, not mortgage rates, but its path and balance‑sheet signals (QE/QT) influence longer yields.
- Treasury supply & auctions – Bigger deficits mean more bond issuance. If demand lags supply, yields rise; strong auction coverage can pull them lower.
- Risk appetite (“risk‑on/risk‑off”) – Flight to safety (geopolitics, recession fears) → buy Treasuries → yields fall; risk‑on → yields can rise.
- Global demand & currency moves – Foreign buyers, hedging costs, and the dollar can amplify moves.
Why mortgage rates sometimes don’t perfectly follow
- MBS-specific supply/demand: If mortgage bonds underperform Treasuries (wider spreads), retail rates won’t fall as much as the 10‑year suggests.
- Prepayment/extension risk: Falling rates raise prepays/refis (bad for MBS); rising rates extend durations. Investors re‑price this risk daily.
- Lender pipelines & pricing windows: Intraday reprices, margins, and loan‑level price adjustments mean the retail quote isn’t a live tick of the 10‑year.
What’s likely next? (scenario map)
- Disinflation + dovish Fed tone + strong auction demand → lower 10‑year, tighter MBS spreads → rate improvement more likely.
- Sticky inflation + hot growth data + heavy issuance → higher 10‑year, wider spreads → upside pressure on rates.
- Chop/volatility days → quick intraday reprices possible; lock bias if closing soon.
Lock vs. Float quick guide
- Closing ≤ 15 days: Lean lock—protect your final terms against headline risk.
- 15–45 days: Data‑dependent. If key releases (CPI, jobs) are ahead and your file benefits from a dip, a measured float may make sense with a defined trigger to lock.
- 45+ days: Optimize with RateWatch 2.0 (targets + alerts). Consider buy‑down options and float‑down language if available.
Fast FAQ
- Does the Fed set mortgage rates? No. The Fed sets short‑term rates. Mortgage rates are market‑based, driven by MBS pricing, which tracks the 10‑year over time.
- What’s a normal spread? Historically ~1.5%–2.0% above the 10‑year, but it widens/narrows with risk, liquidity, and Fed balance‑sheet effects.
- Why did the 10‑year fall but my quote didn’t? MBS may have underperformed, lenders may not have repriced yet, or your loan profile carries adjustments.
Chapters (edit to match your video)
- 00:00 Hook — Why the 10‑year matters
- 01:05 The 10‑year → MBS → your mortgage rate
- 03:10 What moves the 10‑year (inflation, Fed, auctions)
- 06:20 Why spreads change & why rates lag sometimes
- 09:15 Lock vs. float playbook + RateWatch setup
- 11:30 Q&A and next steps
Disclosures: Information is educational only and not a commitment to lend or rate guarantee. Programs, pricing, and eligibility are subject to change. Equal Housing Lender.
