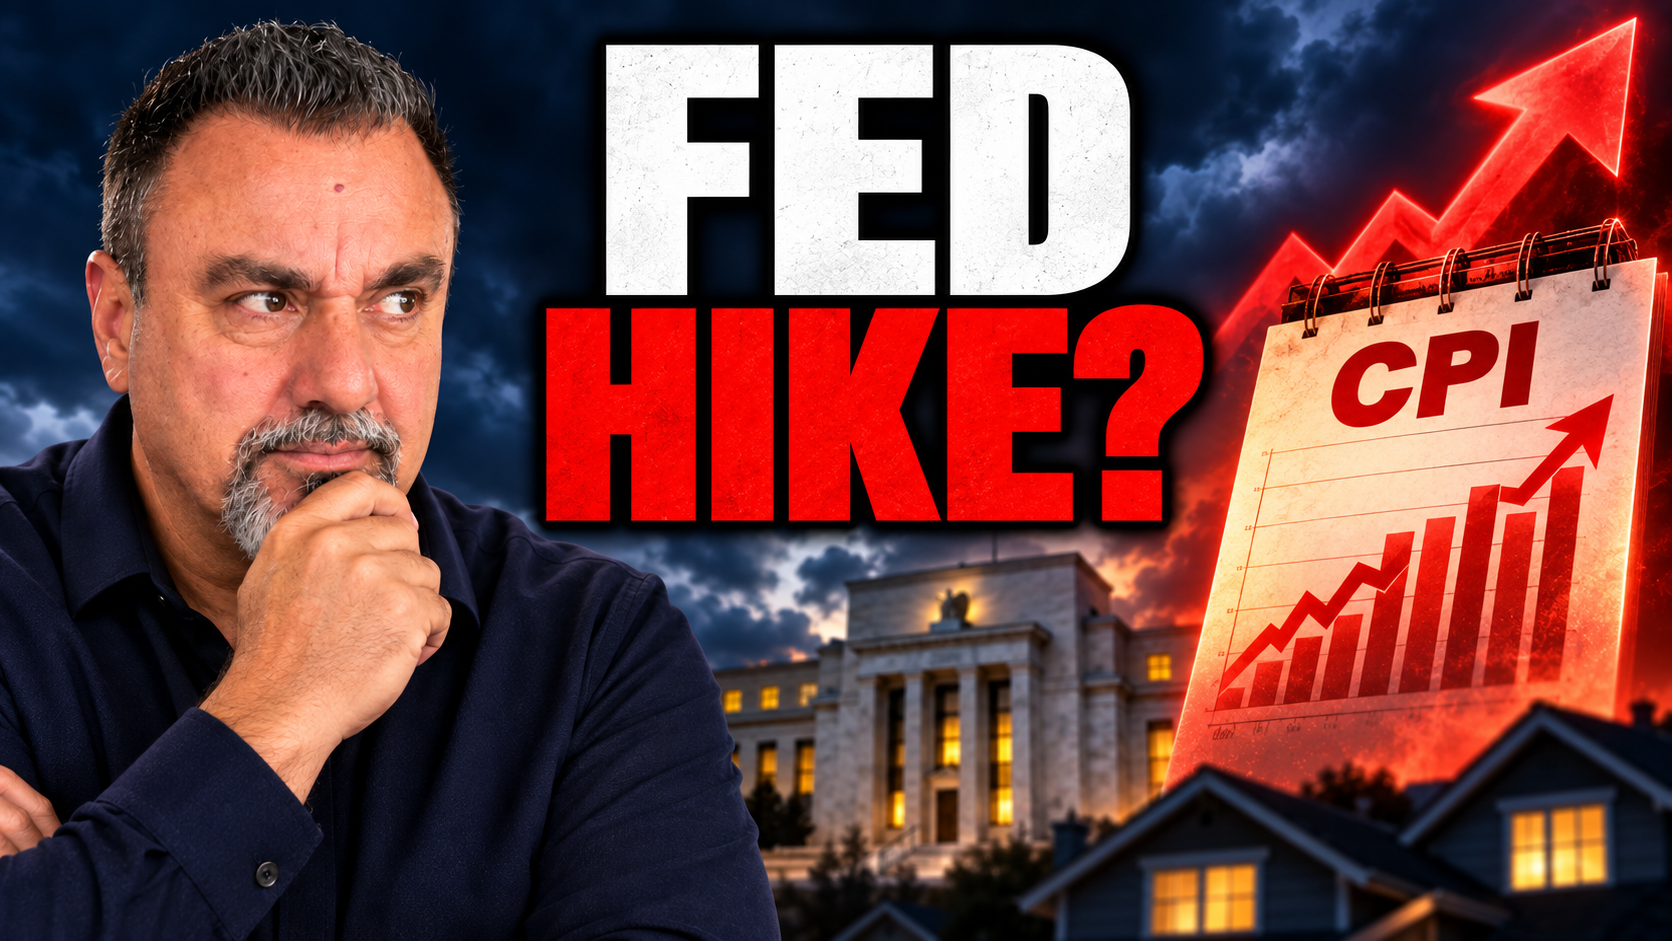
CPI, PPI and both core readings arrive just before the Federal Reserve meets. Here is our forecast, the data behind it and the result we believe is most likely.
Inflation will likely look hot at the headline level, but less threatening underneath. Our Fed call is a 55% probability of a hold and 45% probability of a 25-basis-point hike.
This is a close call, not a certainty. If core CPI prints 0.3%, we estimate the probability of a hike rises to roughly 70%. If core CPI prints 0.2%, we put the hike probability near 15%. One rounding decision could change the meeting.
| Event | Date | Time ET | Why it matters |
|---|---|---|---|
| OPEC monthly report | Thursday, Sept. 10 | 6:00 a.m. | Energy outlook before PPI |
| August PPI | Thursday, Sept. 10 | 8:30 a.m. | Wholesale and pipeline inflation |
| 30-year Treasury reopening | Thursday, Sept. 10 | 1:00 p.m. | Direct test of long-bond demand |
| August CPI | Friday, Sept. 11 | 8:30 a.m. | Final major inflation report before the vote |
| Michigan sentiment | Friday, Sept. 11 | 10:00 a.m. | Inflation expectations |
| FOMC decision | Wednesday, Sept. 16 | 2:00 p.m. | Hold or first hike in years |
Fed officials are in their communications blackout. Friday’s CPI is the final major inflation reading before the committee votes.
| Report | July | Consensus | Our forecast | Signal |
|---|---|---|---|---|
| PPI, month over month | 0.0% | +0.4% | +0.5% | Hotter |
| PPI, year over year | 4.7% | — | about 5.0%–5.2% | Pipeline pressure |
| Core PPI, month over month Excluding food and energy | +0.2% | +0.3% | +0.4% | Above consensus |
| CPI, month over month | +0.1% | +0.4% | +0.4% | Energy-driven jump |
| CPI, year over year | 3.4% | 3.4% | 3.4% | Still elevated |
| Core CPI, month over month | +0.2% | +0.2% | +0.26% | 55% chance it rounds to 0.3% |
| Core CPI, year over year | 2.5% | 2.4% | 2.4% | Gradual cooling |
Core PPI conventions vary. This forecast refers to final demand excluding food and energy; the less-food-energy-and-trade-services measure should also remain firm. Forecasts are estimates, not released government data.
July’s producer prices were flat because a 0.7% drop in final-demand goods offset rising services and construction. That relief is unlikely to repeat. Petroleum-linked input costs increased, tariff-sensitive materials remained expensive and the diesel crack spread reached a record level.
The Institute for Supply Management’s manufacturing Prices Index held at 71.1. Its services Prices Index rose to 72.6, the highest reading since August 2022. Fifteen services industries reported paying higher prices and none reported paying less. These are diffusion indexes—not direct PPI forecasts—but they show unusually broad price pressure.
A base effect also matters. August 2025 PPI declined 0.1% month over month. Replacing that negative month in the annual comparison with our +0.5% forecast would push annual wholesale inflation toward a 5-handle. We assign a 65% probability that annual PPI prints at or above 5.0%.
Our biggest risk: portfolio-management prices surged 6.5% in July. A reversal could pull the monthly PPI result closer to +0.3%.
Headline CPI should rebound as August energy costs replace July’s relief, when the energy index fell 1.5% and gasoline fell 2.9%. That supports our +0.41% monthly headline forecast. The later rise in crude toward $97 is primarily a September and October CPI issue—not an August one.
Underneath the headline, shelter has been moderating, wage growth is not showing a new spiral and July core CPI was only +0.2%. The Cleveland Fed’s August nowcast is +0.36% headline and +0.20% core. We are slightly above its core estimate because service-sector price surveys and vehicle-related demand point to upside risk.
The annual comparison matters too: a relatively high August 2025 CPI reading drops out. That allows annual core CPI to fall from 2.5% to roughly 2.4% even if the monthly core number edges higher.
The BLS reported 162,000 August payroll gains and upward revisions to June and July. But ADP monthly payrolls were only 38,000, its latest weekly pace translates to roughly 48,000 per month, and ISM Services Employment remained in contraction at 47.8.
Wage data are more consistent: BLS average hourly earnings rose 3.1% annually and ADP base pay rose 3.2%. That does not look like a wage spiral. This contradiction—firm official payrolls but much softer private and survey measures—is a major reason we lean toward a hold rather than a reversal of policy direction.
Consumer demand is firmer than the headline suggests. July consumer credit rose $18.06 billion, but only $2.80 billion came from revolving credit cards. The majority came from non-revolving auto and student lending, including the largest monthly increase in three years. That looks more like big-ticket demand than distress borrowing and adds mild upside risk to vehicle prices.
The current federal funds target is 3.50%–3.75%. Our base case is a hold with 55% probability, versus a 25-basis-point hike at 45%. That sits slightly below current market pricing for a hike.
If core CPI prints 0.3%We estimate roughly a 70% probability of a hike. A hot PPI reading, firm growth and broad services inflation would strengthen that case. | If core CPI prints 0.2%We estimate only a 15% probability of a hike. Cooling annual core inflation, stable expectations and mixed labor data would favor holding. |
The hinge is core CPI—not the headline alone.
We lean hold because annual core inflation is likely to ease, wage growth is not spiraling, employment signals conflict and the consensus inflation forecast meets the condition policymakers have described for patience.
Why we may be wrong: the bond market is leaning the other way. The September 8 three-year Treasury auction cleared 18 basis points above the prior auction. Alongside strong GDP tracking, elevated oil and a 4.7% producer-price reading, that is meaningful evidence that investors remain concerned about inflation and Fed credibility.
The Fed controls a short-term overnight rate. Fixed mortgage rates respond more directly to the 10-year Treasury and mortgage-backed securities. The 10-year yield reflects expected future short-term rates, expected inflation and a term premium for locking money up for a decade.
That creates a result many borrowers find counterintuitive: a Fed cut or dovish hold can push mortgage rates higher if bond investors believe the Fed is easing before inflation is beaten. A credible hike can sometimes pull longer-term yields lower by convincing investors that inflation will be contained.
The clearest recent example came in late 2024. The Fed cut a total of 100 basis points, but the 10-year Treasury and the average 30-year fixed mortgage rose by roughly a full percentage point over the same broad window.
| Fed outcome | Likely long-rate response | Possible mortgage response |
|---|---|---|
| Hike, framed as sufficient | Modest bond rally; yields down | Could improve over the following 1–2 weeks |
| Hike, framed as first of several | Two-year up; 10-year mixed | Flat to slightly higher |
| Hold, hawkish language | Modest yield increase | Slightly higher |
| Hold, dovish language | Credibility and term-premium risk | Potentially higher |
A dovish hold may be the worst outcome for a 30-year fixed mortgage if investors see it as insufficient against inflation. But a hike would immediately hurt borrowers with HELOCs, adjusting ARMs, construction loans and other short-rate products. Those borrowers and fixed-rate mortgage borrowers can have opposite interests.
To isolate the rate impact, this comparison assumes a $350,000 loan amount, a 30-year fixed mortgage and principal-and-interest payments only. Taxes, insurance, mortgage insurance, HOA charges and closing costs are excluded.
| Rate | Monthly P&I | Payment increase | Loan supported by $2,096 payment | Purchasing-power loss |
|---|---|---|---|---|
| 5.99% | $2,096 | Baseline | $350,000 | Baseline |
| 6.99% | $2,326 | +$230/month | $315,390 | -$34,610 |
| 7.99% | $2,566 | +$470/month | $285,946 | -$64,054 |
Calculations are rounded to the nearest dollar and assume 360 equal monthly payments. Purchasing power refers to loan principal, not home price. With the same down-payment percentage, the change in maximum home price would be larger.
| Prediction | Our confidence |
|---|---|
| PPI year over year prints at or above 5.0% | 65% |
| PPI monthly meets or exceeds +0.4% | 60% |
| Core CPI rounds to 0.3% | 55% |
| Headline CPI lands within 0.1 point of +0.4% | 80% |
| Fed holds September 16 | 55% |
| Fed hikes September 16 | 45% |
The cleanest way to describe this week is simple: headline inflation will tell us how painful the shock is; core inflation will tell us whether it is spreading. The second answer is the one most likely to decide next week’s Fed vote—and the direction of mortgage rates.
One application, 30+ lenders compete. Check live rates and start on your own with the DIY Mortgage path, or talk it through with Dan directly at (630) 360-3490.
Start the DIY MortgageRequest a ConsultationOfficial data: BLS Consumer Price Index; BLS Producer Price Index; Federal Reserve FOMC calendar; Cleveland Fed inflation nowcasting; ISM Manufacturing; and ISM Services.
These are calibrated probability estimates, not a historical accuracy rate. This is the first published forecast in this series, and results should be compared with this table after release.
This material is for informational and educational purposes only. It is not financial, investment, tax, or legal advice, and it is not a recommendation to lock or float any mortgage rate. Economic forecasts are estimates and may prove inaccurate. Individual circumstances vary; consult a qualified professional regarding your specific situation. Mortgage products are originated by PBT Bancorp, NMLS #257781.
Dan Frio | NMLS #246527 | PBT Bancorp | NMLS #257781 | 524 Main St, Hazard, KY 41701