The Rate Update with Dan Frio · September 23, 2026
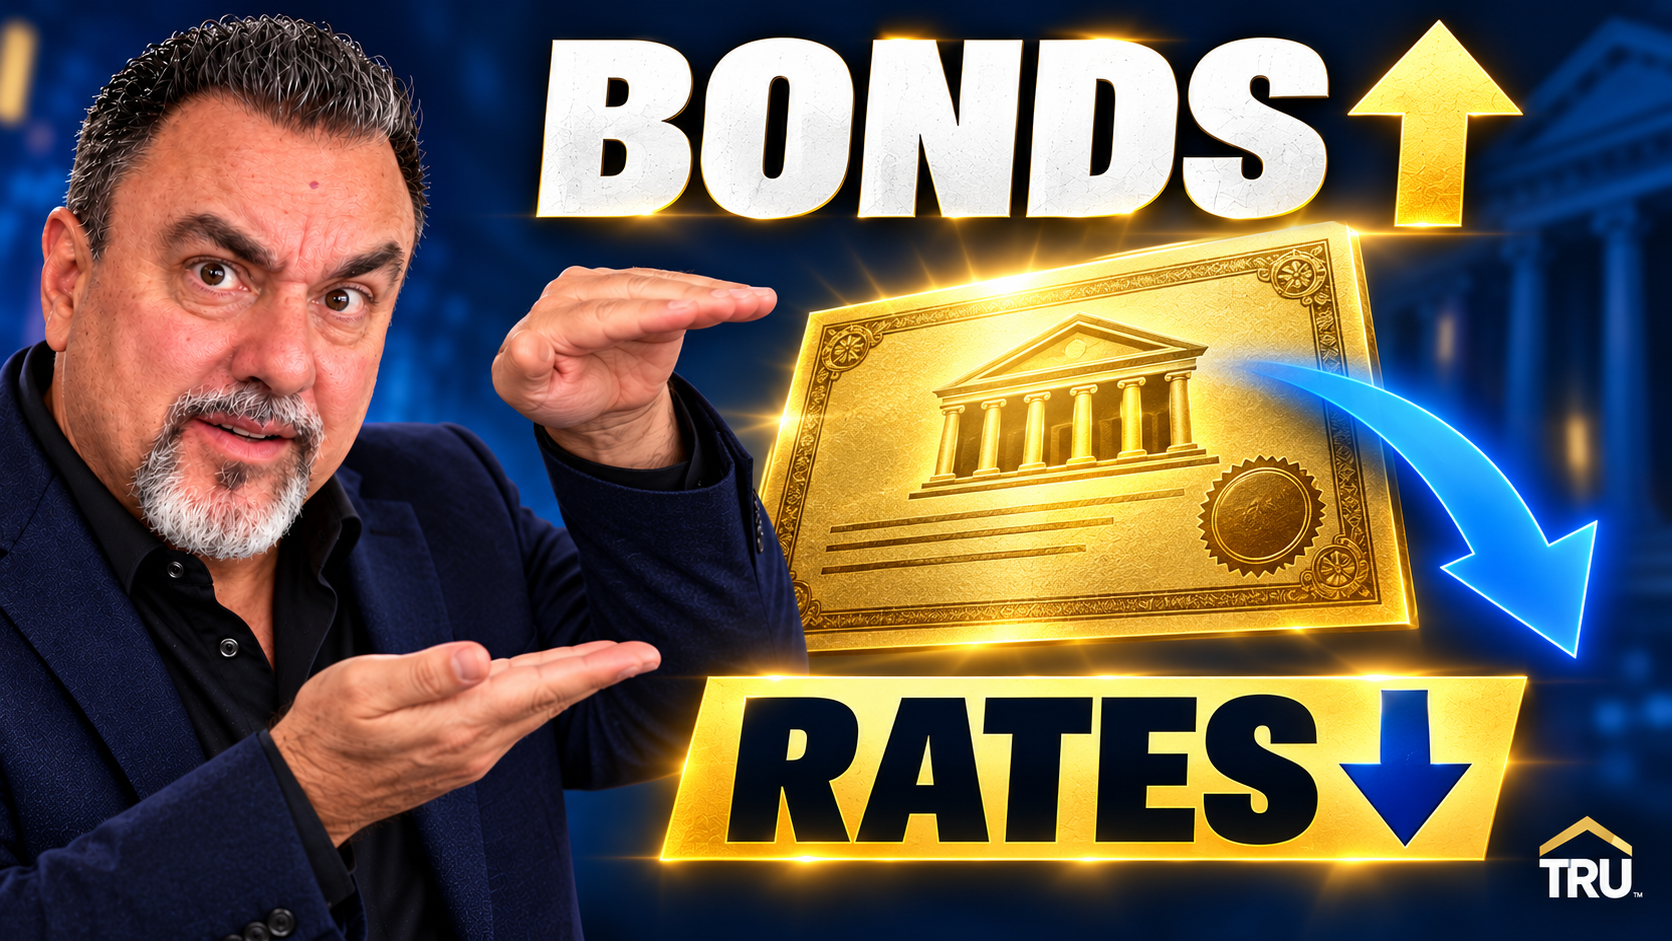
When you see the price of a mortgage bond rise, the return available to the next investor falls. That is the simple relationship behind many mortgage rate moves.
Imagine a one-year zero-coupon bond: it pays $100 in one year and makes no interest payments along the way. The cash received stays $100. Only the purchase price changes.
This is a teaching example for a zero-coupon bond with exactly one year remaining. A bond that pays an annual coupon still has coupon income when its price reaches $100.
Assume a $400,000 home, 20% down ($80,000), a $320,000 loan and a 30-year fixed term. The rates below are hypothetical comparisons, not quotes.
Principal and interest only. Property tax, homeowners insurance, mortgage insurance, HOA dues and closing costs are excluded.
Suppose your principal-and-interest ceiling is $2,129 a month and you put 20% down. As the rate rises, the home price that fits that same payment falls.
| 📊 Rate | 🏠 Approximate home price | 💵 20% down |
|---|---|---|
| 6% | $444,000 | $88,800 |
| 7% | $400,000 | $80,000 |
| 8% | $363,000 | $72,600 |
A borrower’s mortgage rate is not identical to an MBS yield. Servicing, guarantees, lender costs, points and the timing of rate sheets all matter. If a chart is green, check whether it plots price or yield: green price is generally favorable for mortgage pricing; green yield generally is not.
Compare your actual rate, points, lender fees and payment on a written Loan Estimate. Ask Dan at TheRateUpdate.com.
Sources: SEC bond price and yield explainer; Freddie Mac MBS guide; Fannie Mae mortgage rate explainer. Mortgage payment figures use standard 360-month amortization and are rounded. Illustration only, not a rate offer. Dan Frio, NMLS #246527; PBT Bancorp, NMLS #257781.