
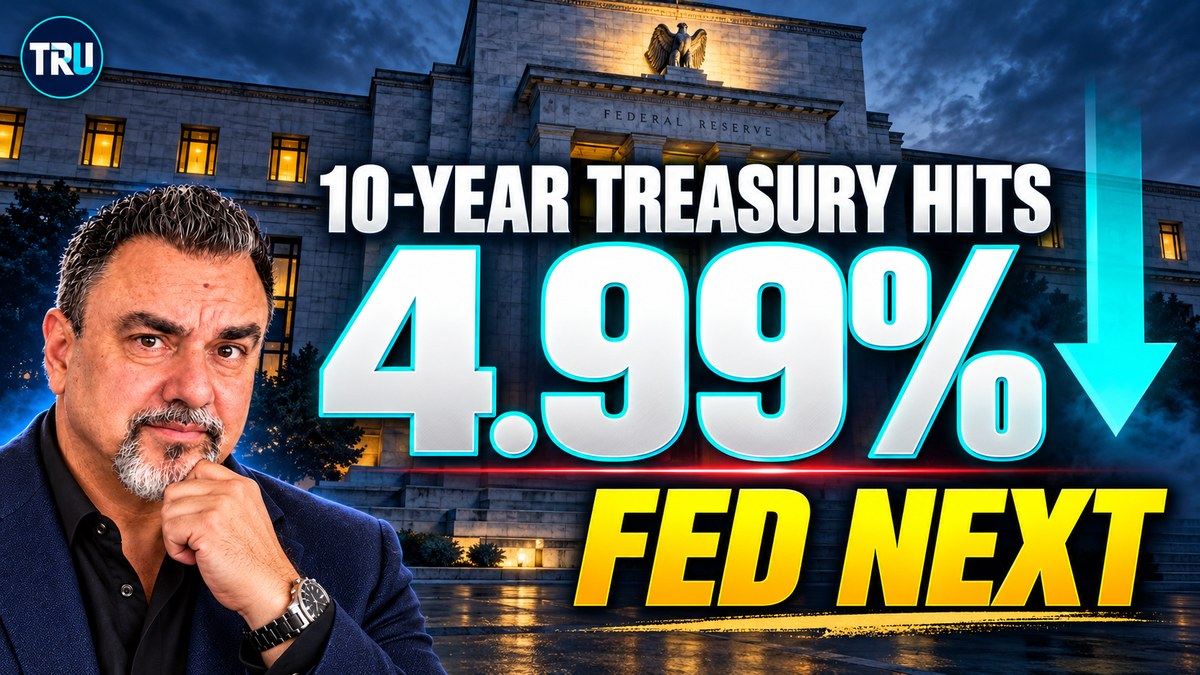
Rates Hit a 1-Month Low.
WILL THE FED LET IT LAST?
A tech selloff sent investors into Treasuries and mortgage bonds on Thursday. Here's why rates fell, what the Fed is watching, what happens next week, and what to do about it.
Mortgage rates fell to 7.30% on Thursday, the lowest since September 23. The Fed didn't do anything. Inflation didn't cool. Oil actually went up. So why did rates drop, and how long can it last with the Fed meeting on Wednesday and the Fed's favorite inflation number out Thursday?
1. Wall Street ran to bonds. Your rate followed.
Editorial illustrationMeta's AI bill
Meta beat on revenue and profit, then raised its spending outlook and disclosed about $825 billion in future commitments. It also said its AI spending produced its first cash outflow in more than a decade.
The selloff spread
Chipmakers, AI infrastructure and cloud names fell with it. The Nasdaq had its worst day since June.
Money looked for safety
Money leaving tech went to U.S. Treasuries and mortgage bonds. When demand for those bonds rises, their yields fall and mortgage rates follow.
The 10-year Treasury fell from about 5.13% to 4.97% in one session, back under 5% for the first time in weeks. Some desks called it the biggest one-day drop since the 2023 banking scare. The 2-year yield fell about 18 basis points, which tells you traders also cut their bets on another Fed hike.
Oil rose 4% on the same day bonds rallied. Fear about stocks won out over fear of inflation, and that can flip.
This morning the 10-year is back near 4.98%, a small give-back. The rally came from fear. Inflation has not improved, and that matters for what comes next.
2. What the Fed is watching: inflation, jobs and oil.
Editorial illustrationThe Fed has two jobs: keep prices stable and keep people working. Right now those two point in different directions. Inflation is moving the wrong way, and the job market is cooling.
| Measure | Latest | 30 days ago | A year ago | Direction |
|---|---|---|---|---|
| CPI inflation | 3.7% | 3.4% | 3.0% | Rising |
| Core CPI | 2.6% | 2.4% | n/a | Rising |
| PCE inflation | 3.4% | 3.4% | 2.8% (Jan) | Higher in Sept? |
| Core PCE | 3.0% | 3.0% | 3.0% (Dec) | Flat, sticky |
| Job growth | +29K | +133K | n/a | Cooling |
| Unemployment | 4.2% | 4.1% | n/a | Edging up |
| Brent crude | $113.61 | +6.7% in a month | +74.4% in a year | Rising |
| 10-year Treasury | 4.98% | 4.96–5.18% | about +0.95 pts | Off the highs |
Inflation: CPI is back at 3.7%
Consumer prices rose 0.6% in September and 3.7% from a year ago, up from 3.4% in August. Gasoline jumped 9.1% in the month and did over half the work. The warning sign is core inflation, which strips out food and energy: it rose to 2.6%, and it ran at about a 3.7% annual pace in September alone.
PCE: the Fed's real target arrives Thursday
August PCE came in at 3.4% with core at 3.0%, softer than economists feared. September's report lands Thursday morning, the day after the Fed decides. With gas up 9% in September, I expect the headline number to rise, likely near 3.6%, with core near 3.0–3.1%.
Jobs: hiring slowed hard in September
Employers added just 29,000 jobs, against 84,000 expected, and July and August were revised down a combined 60,000. Unemployment rose to 4.2%. Wages are up 3.0% from a year ago, but after inflation, real pay is down 0.7%. Weekly jobless claims stayed low at 194,000 this week, so this is cooling, not collapse.
Oil: the wildcard
Brent crude settled at $113.17 on Thursday after attacks on Saudi oil sites, its highest in five months. It is up about 74% from a year ago, and gasoline is up about 34%. The longer oil stays here, the more it feeds inflation, and the harder it is for rates to fall.
3. Housing is cooling. Buyers have more room.
Editorial illustrationHome prices are still edging up nationally, but slowly. Contract signings fell 7.3% in September and housing starts missed estimates. Inventory is the highest since late 2019, and it would take 4.8 months to sell what's listed. That's close to the 5-month mark that signals a balanced market, which gives buyers more room to negotiate than they have had in years.
This week in review
4. What this week means for your payment.
Editorial illustrationHere's what this month's swing means on a typical loan. These are illustrations on a $400,000, 30-year fixed loan, principal and interest only, not quotes.
| Rate | Monthly P&I | Saves vs. 7.59% | Per year |
|---|---|---|---|
| 7.59% Oct 7 high | $2,822 | $0 | $0 |
| 7.40% Oct 21 | $2,770 | $52 | $624 |
| 7.30% Oct 22 | $2,742 | $79 | $951 |
| 5.99% 52-week low | $2,396 | $426 | $5,111 |
Getting from 7.59% to 7.30% saves about $79 a month. That helps, but it isn't a refinance trigger for most owners. The 52-week low shows what a real refinance window looks like: about $426 a month less than today.
5. Fed odds and next week’s calendar.
Editorial illustrationThe Fed raised its rate to 3.75%–4.00% in September, its first hike in three years. Officials are now in their quiet period, so there's no more Fed talk until Wednesday's decision.
My read: the Fed holds on Wednesday and keeps December open. The risk is a firm tone from Chair Warsh on Wednesday followed by a hot PCE number Thursday morning. That combination could undo part of this week's gain. With oil above $110, some officials may push to hike sooner, and a split vote is possible.
Next week's calendar (Central Time)
7:30 / 9:00
1:00 / 1:30
7:30
6. Be ready before Wednesday.
Editorial illustrationBuying a home
- Under contract? Today's pricing is a one-month low. Talk about locking before Wednesday and Thursday.
- Update your preapproval now so you can move fast on a good day.
- With supply near 5 months, ask for seller credits or a price cut and compare the dollars.
Already own
- A 0.10 drop rarely makes a refinance pay off. Know your target rate and break-even.
- Bought at 7.5% or higher? Set up Rate Watch so you hear about the real window first.
- Need cash? Ask about home equity options that keep your first mortgage rate.
Real estate agents
- Call rate-sensitive buyers now, before the Fed and PCE.
- Show buyers the payment, not just the price.
- Pair offers with a lender who can compare programs and lock quickly.
The bottom line
Rates fell because investors got scared of tech stocks, not because inflation is solved. Inflation is rising, oil is above $110, and the Fed is still leaning toward one more hike by December. Treat this as a window. Get your approval, your numbers and your target rate ready now, so you can act when the market gives you a good day.
Get ready before the Fed meets
One application. One credit pull. I compare over 30 lenders to find the program that fits you.
Call or text Dan directly: (630) 360-3490
What does the home cost each month?
Start with the payment you are comfortable with, then work backward to the home. The TRU Home Buyer app runs your numbers with taxes, insurance and HOA, and shows what price range fits.
See What You Can Afford →Let’s review your real numbers →
Estimates are illustrations, not a loan quote. Actual payments depend on credit, program, taxes, insurance and underwriting.
Additional sources: CNBC (CPI); Axios (Warsh); Freddie Mac PMMS; Federal Reserve FOMC calendar; BEA release schedule.